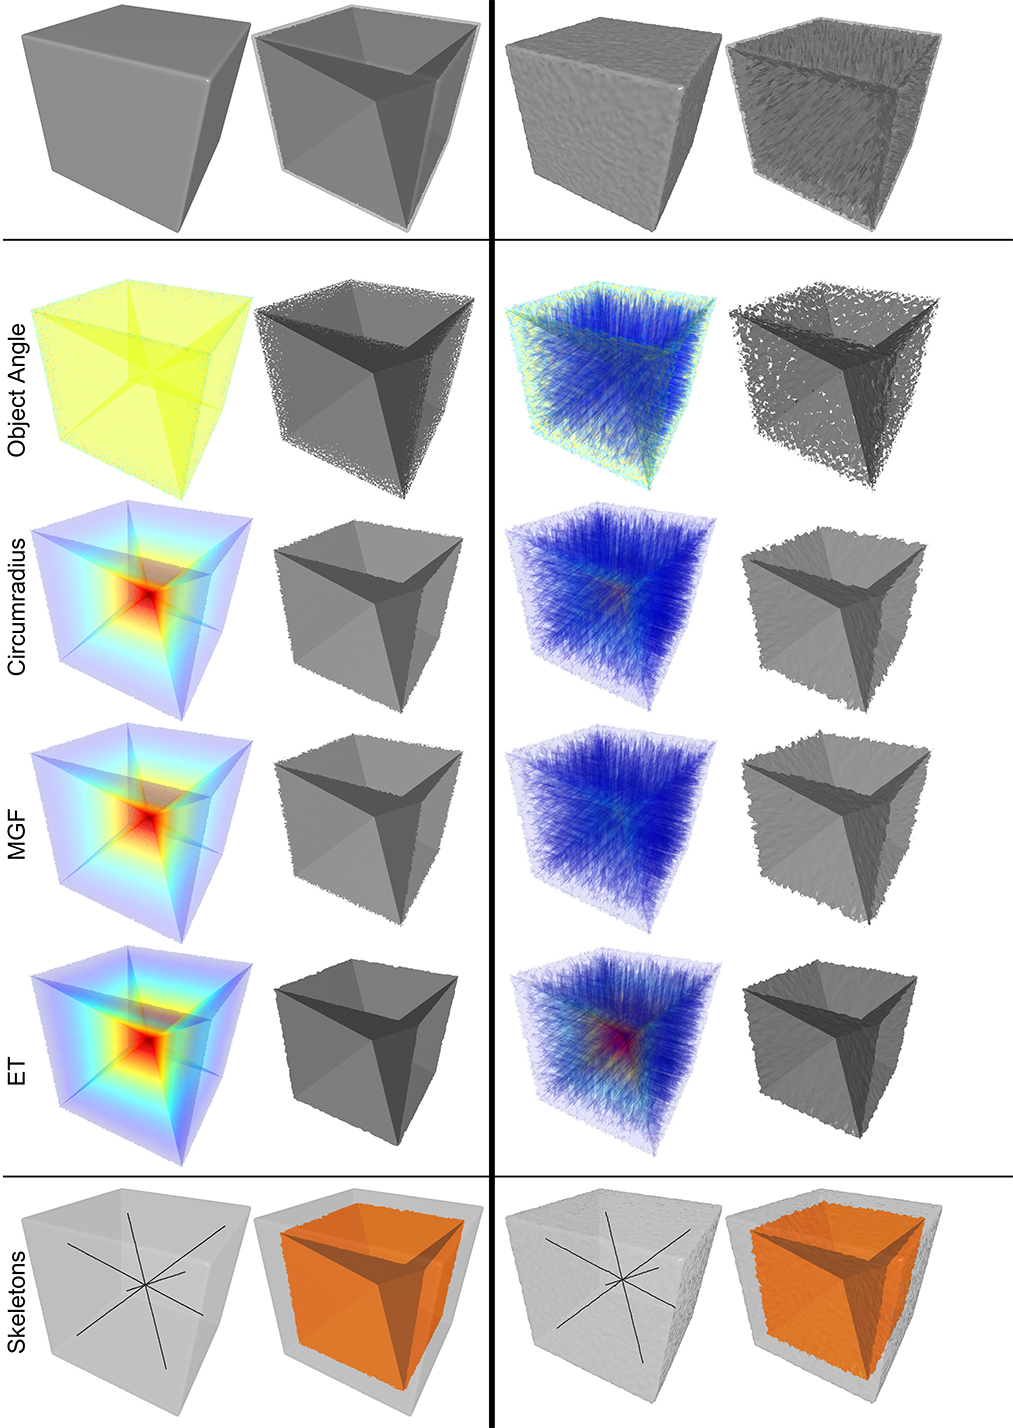
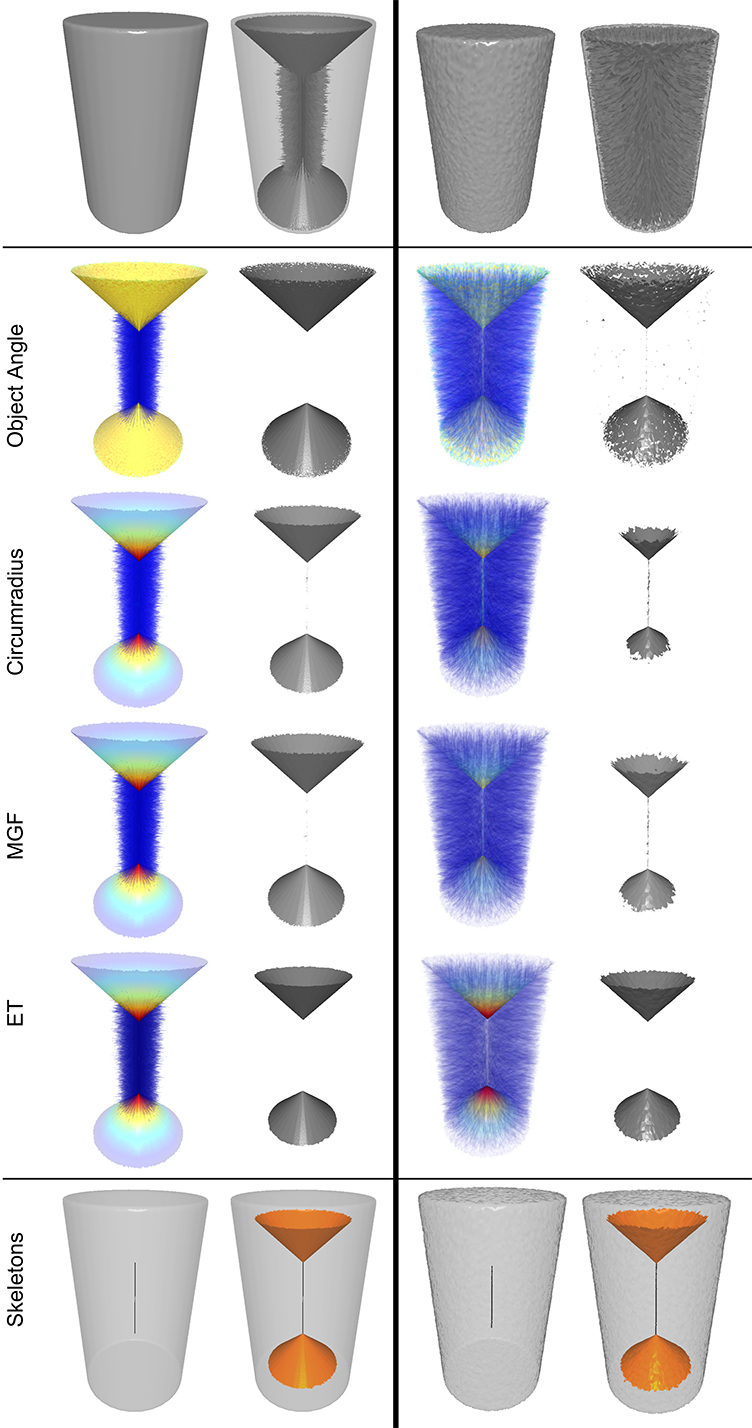
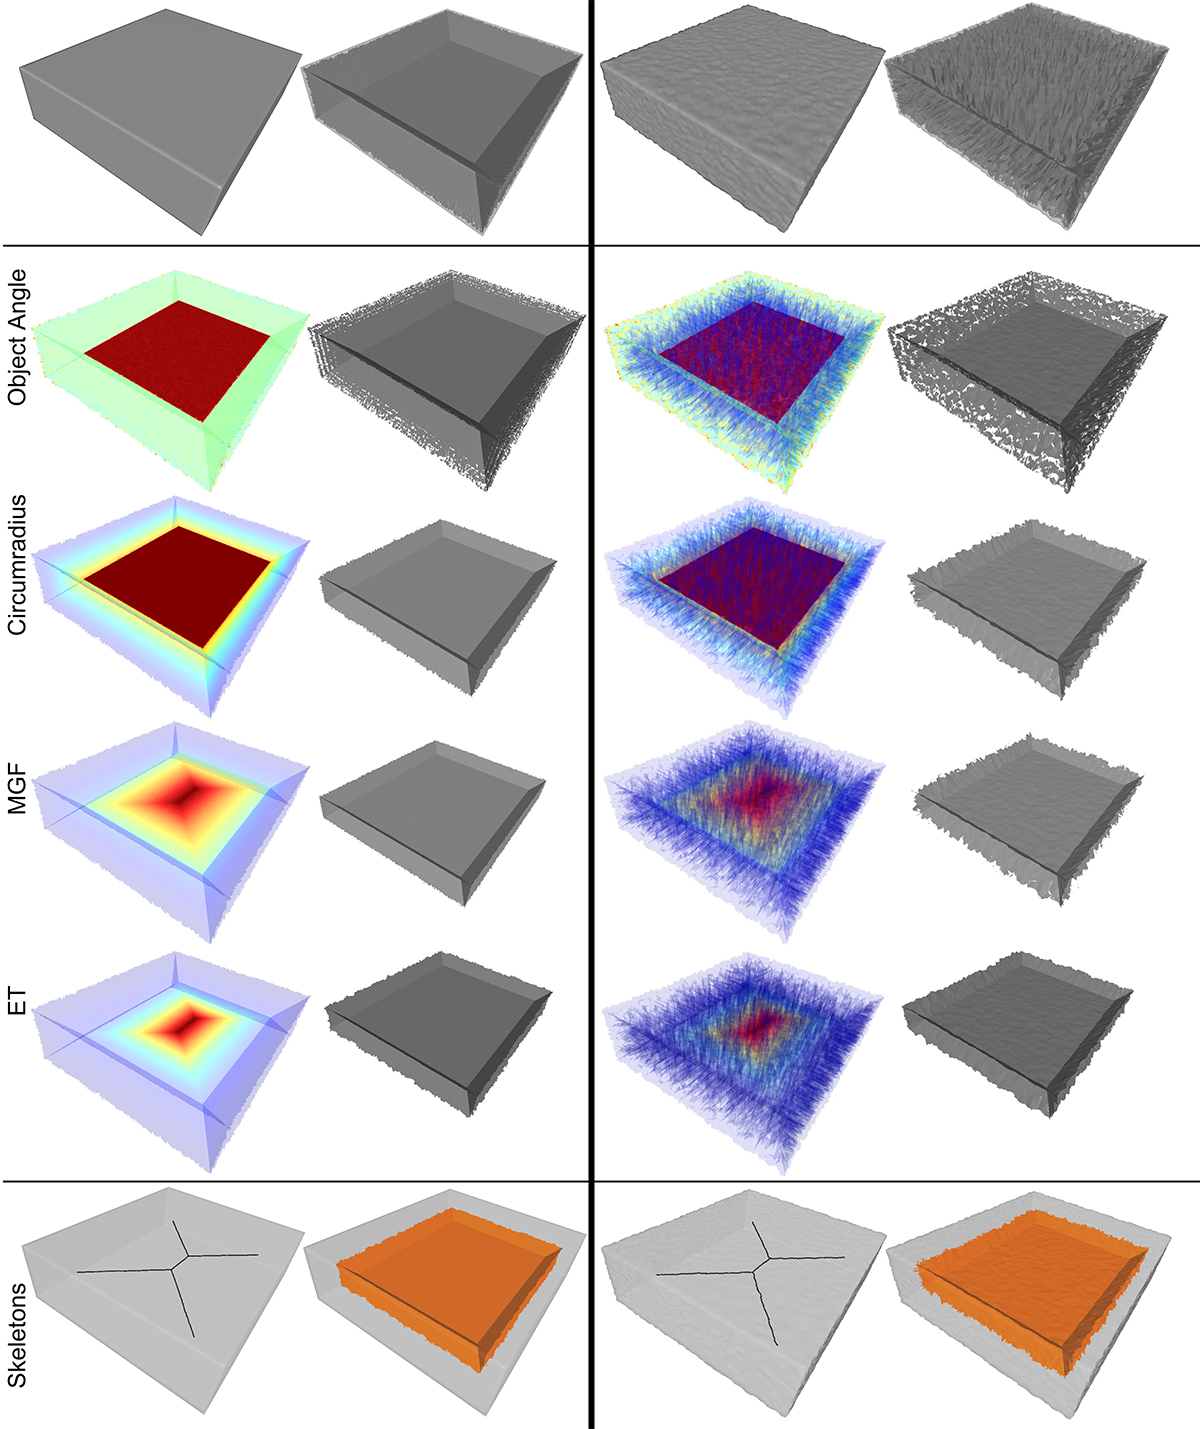
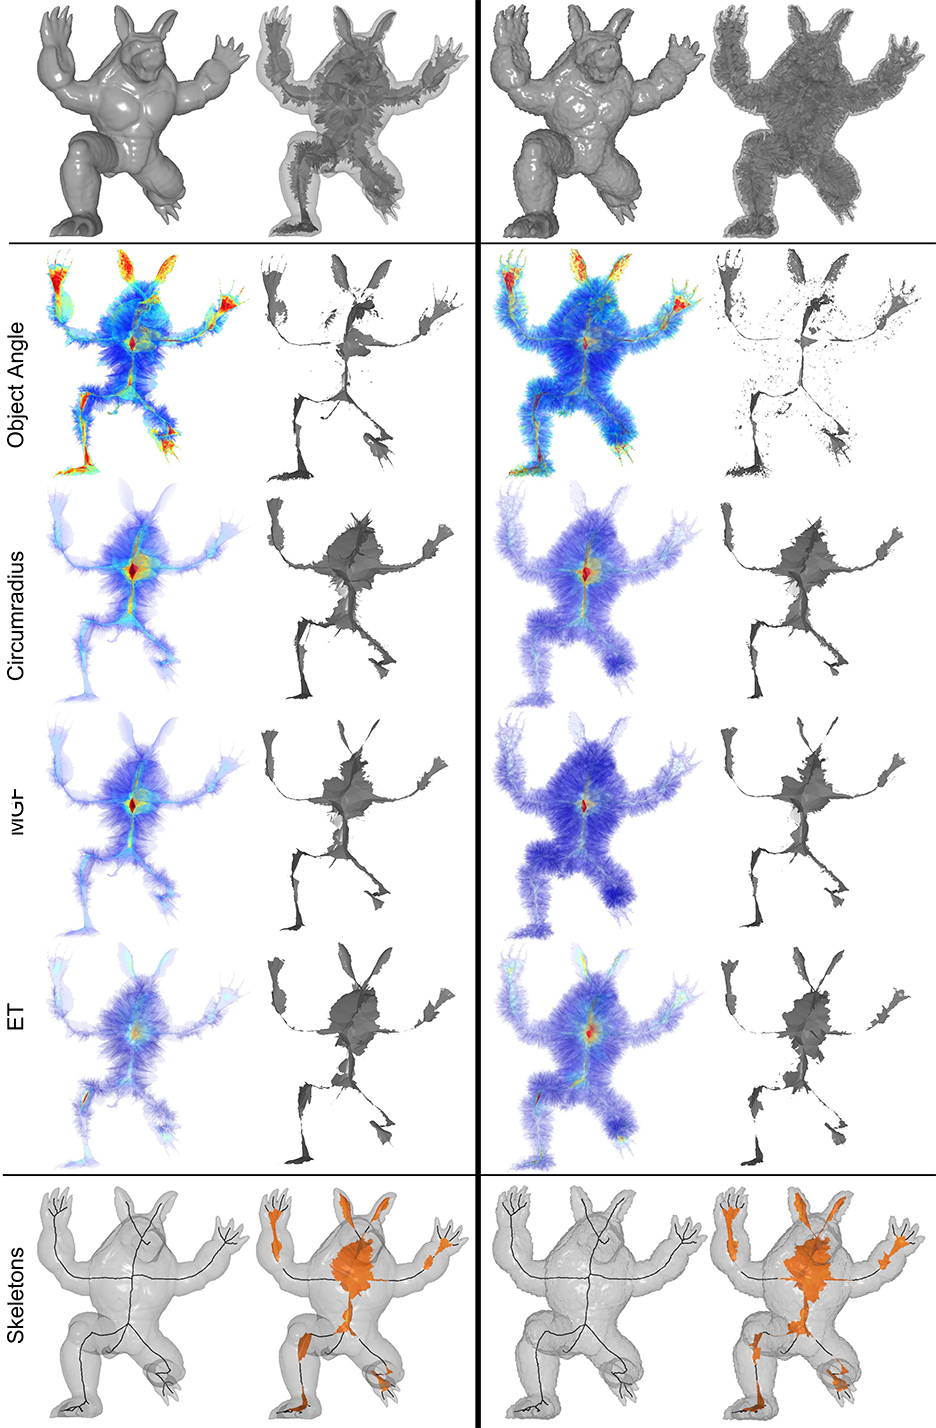
Supplementary material: a gallery of significance measures and skeletons
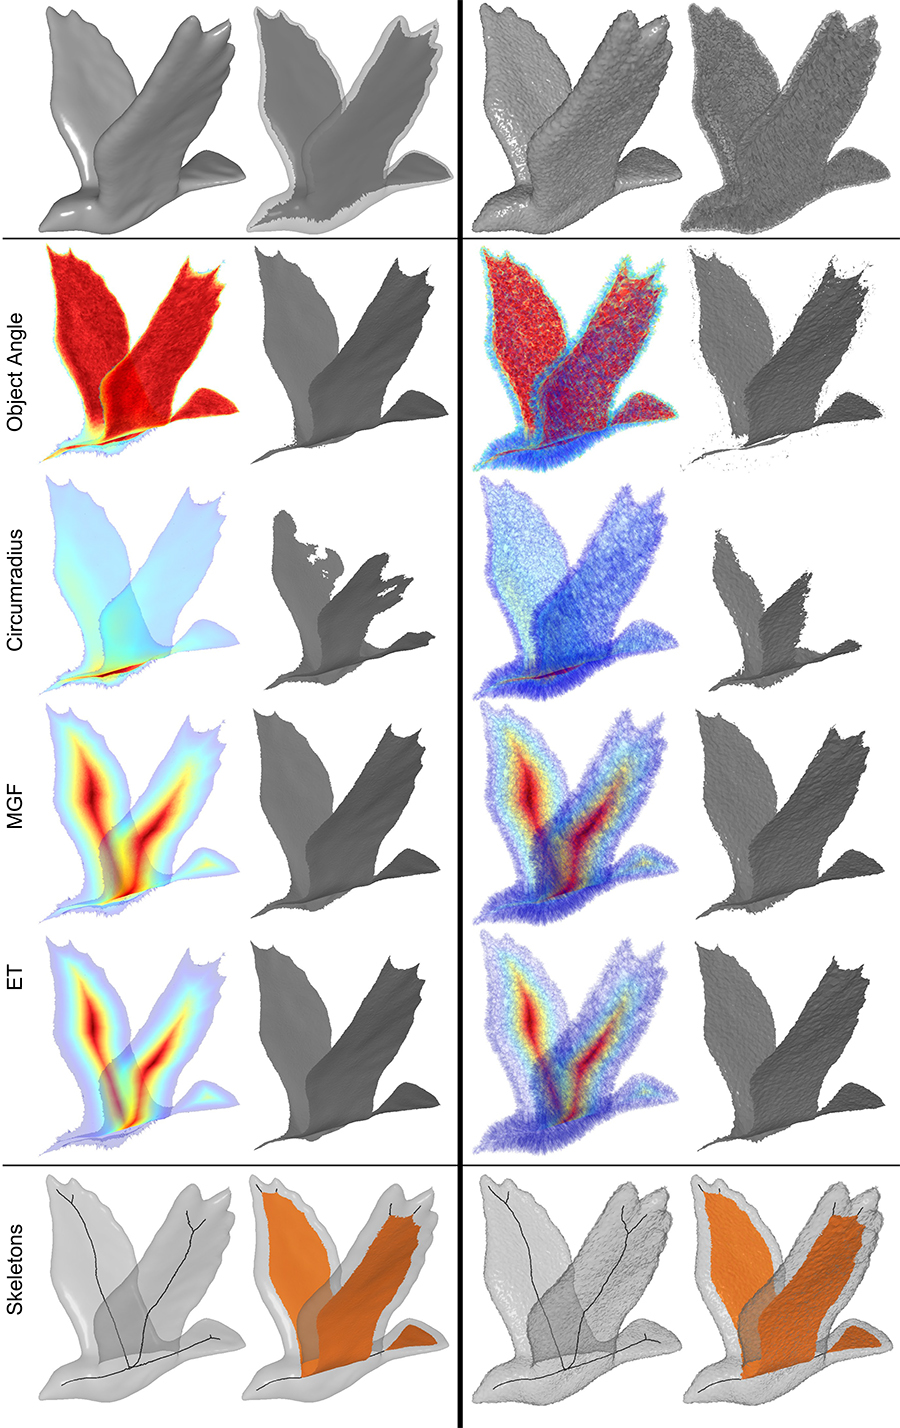
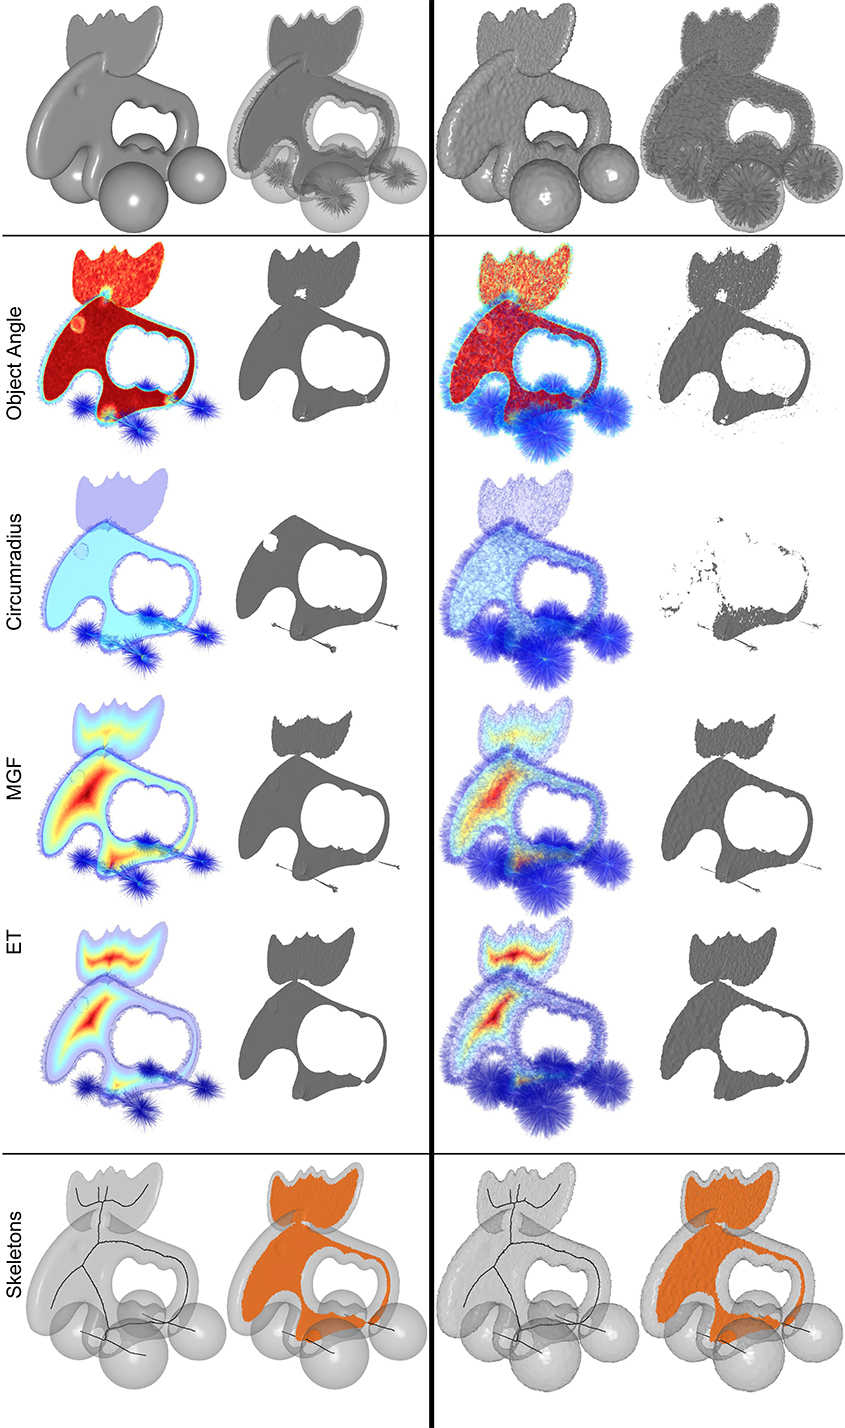
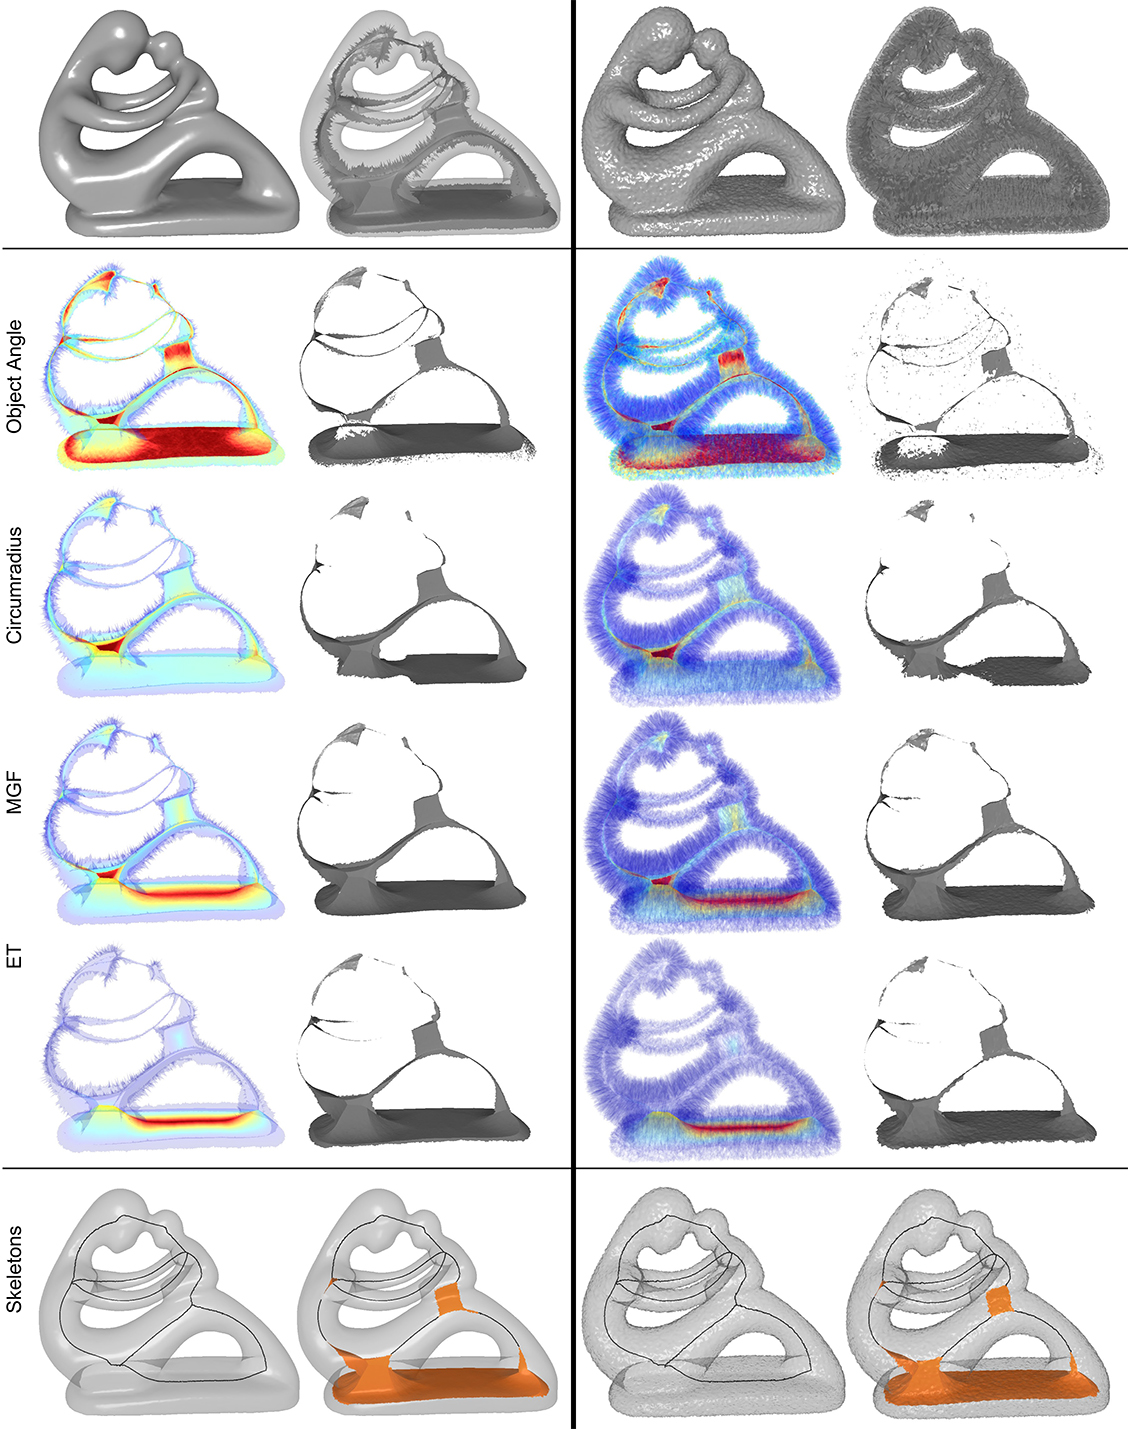
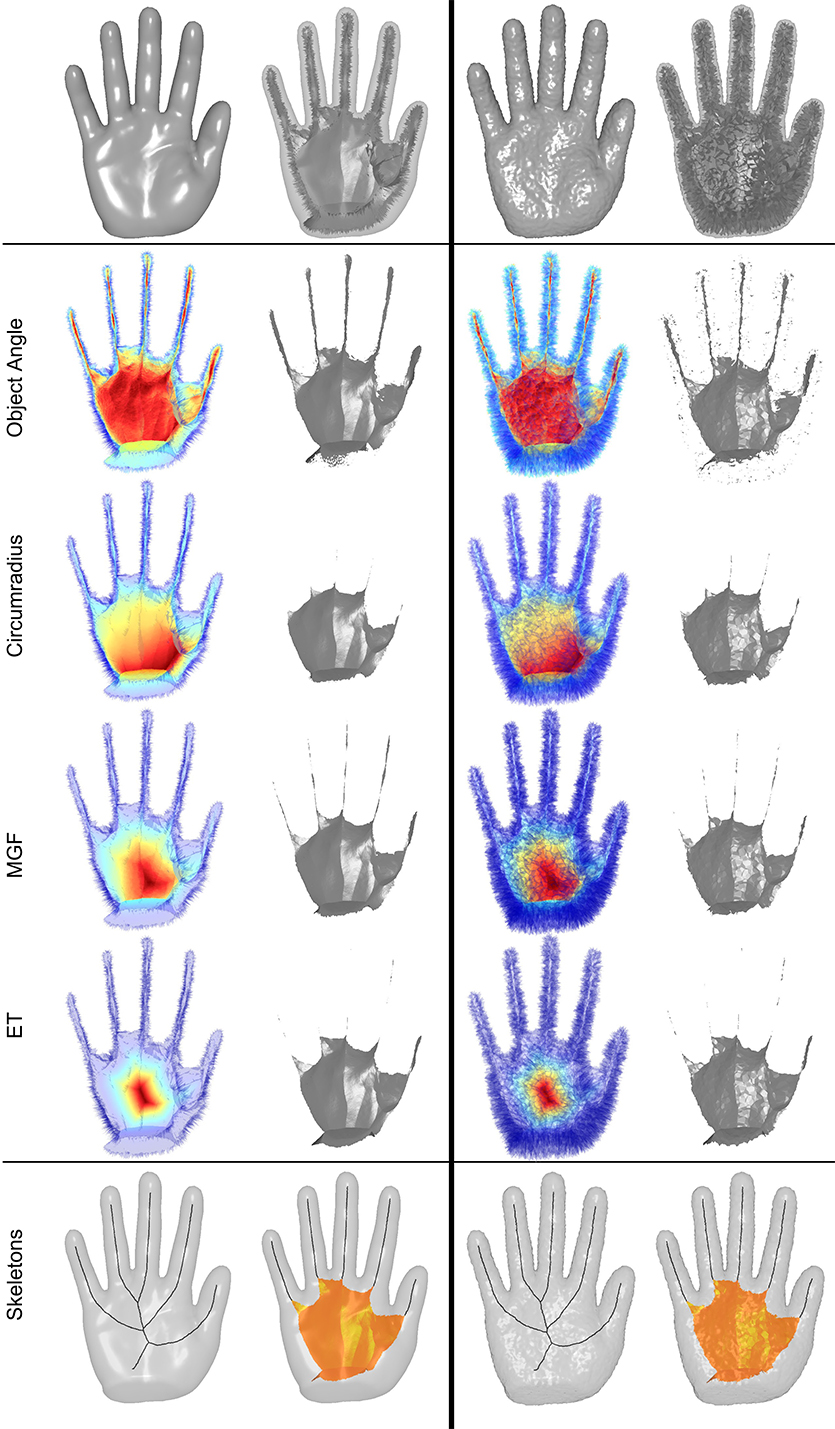
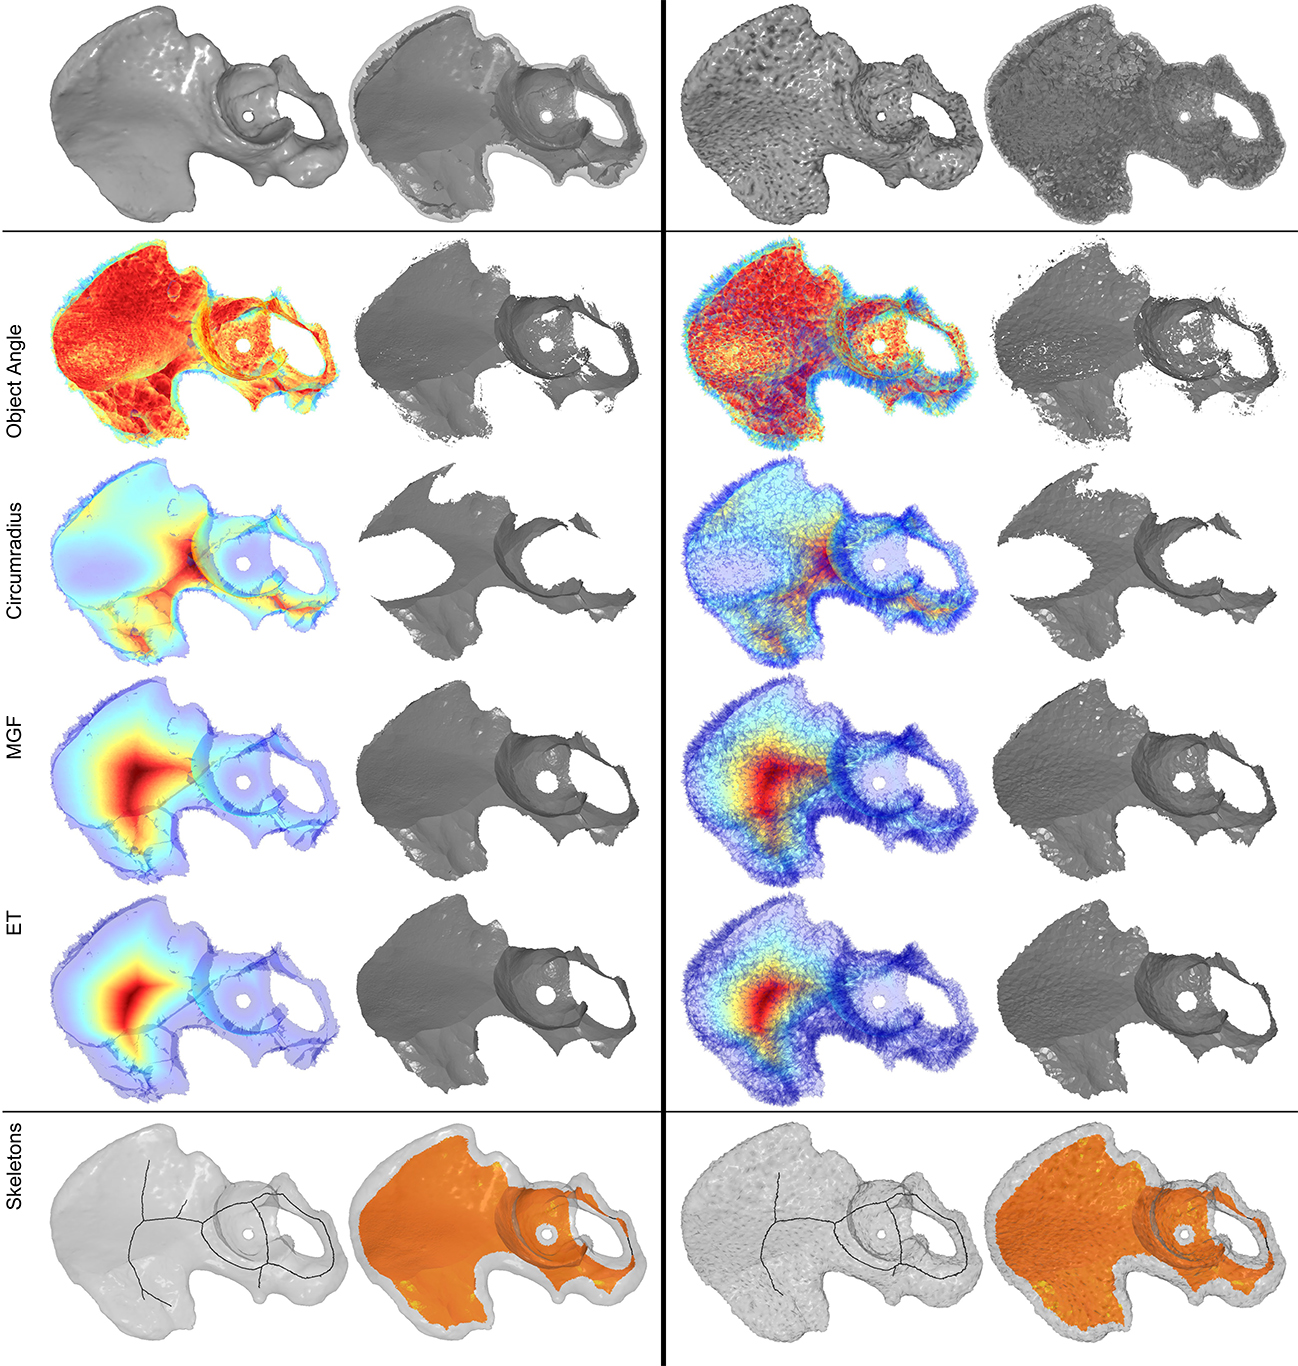
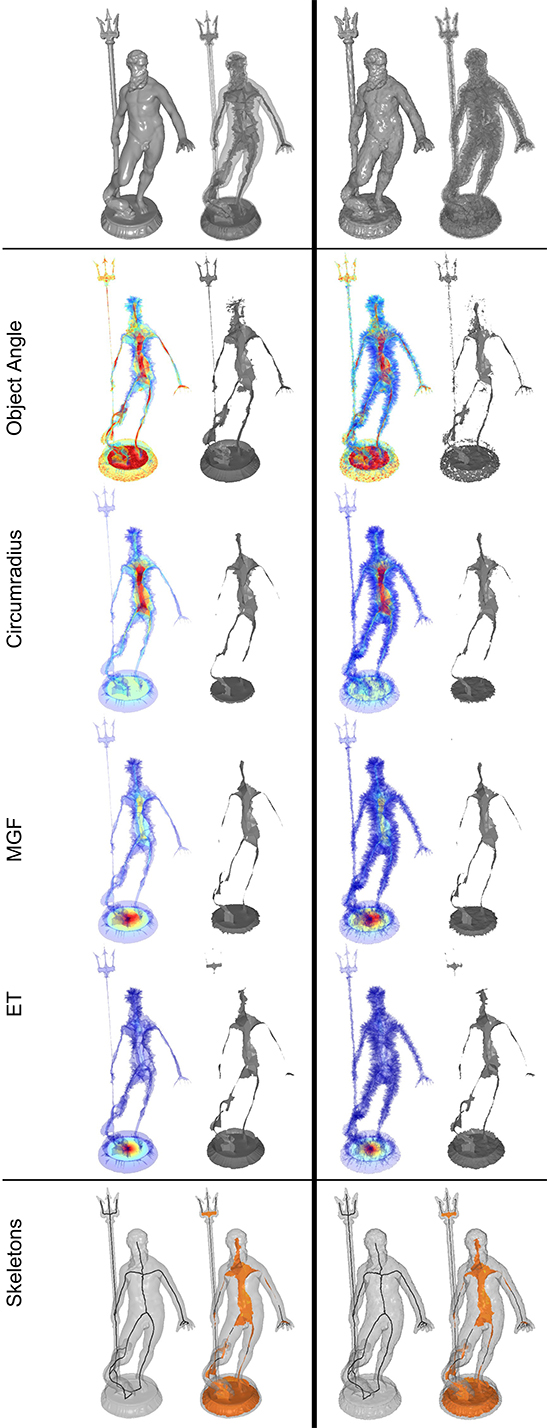
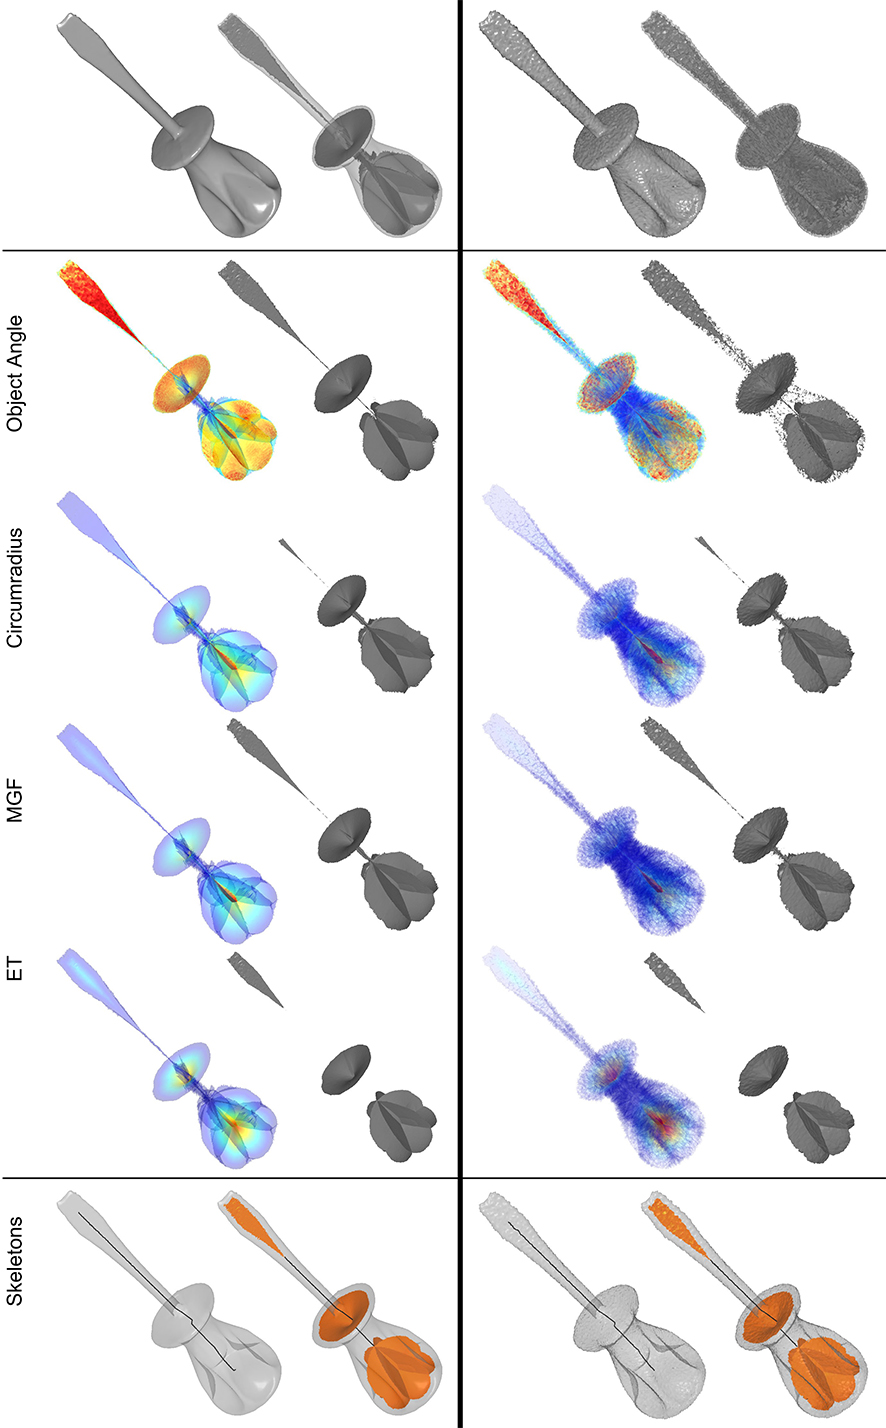
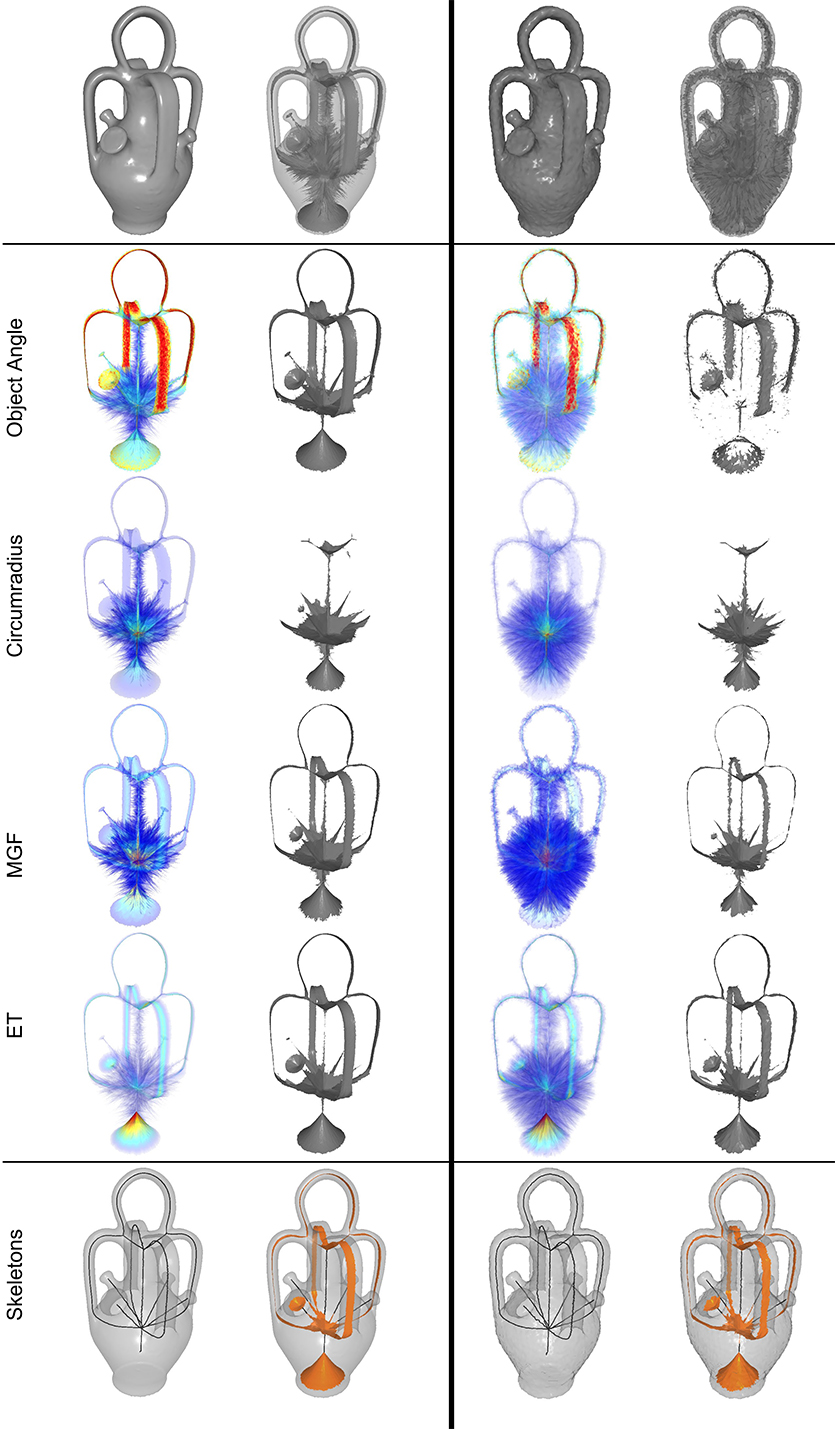
This document compares significance measures (object angle, circumradius, MGF, ET) on 15 shapes before and after boundary perturbation. The first column for each shape visualizes the significance measure by heat color (higher values in red) and transparency (higher values are more opaque). The second column shows the portion of the medial axis whose significance values are higher than a threshold. Two skeletons (a curve-only skeleton and a curve-and-surface skeleton) computed using our method for each shape are shown in the last row.
